RPA Ops Dashboard

A self-service tool to monitor robotic process automations (RPA) to meet security compliance.
the problem
Bot logs in Automation Anywhere (our chosen RPA tool) are full of noise amongst valid bot errors, making it difficult for business unit support teams to identify and prioritize bot errors for completion.
The goal
Create a dashboard view for BUs and SOX teams to record successful completion of critical bot issues so that Deloitte (an external auditor) may observe and close any errors or failures.
My Role
Myself and one other product designer led the discovery and creation of the RPA Ops Dashboard over the course of a short time period— 4 months. I left the project early due to a reorg within the tech department.
I also worked closely with the lead engineer, who also filled a product owner role, as the original product owner left before an MVP was established.

scope & problem framing
With the quick timeline we had, it was important for me to understand the size and scope of the work we had to do. I worked closely with the product owner and lead engineer to determine MVP.

Planning
I organized our tasks, milestones, and check-ins against a timeline following a 2 week sprint cadence in collaboration with engineering efforts.

Workshop Facilitation
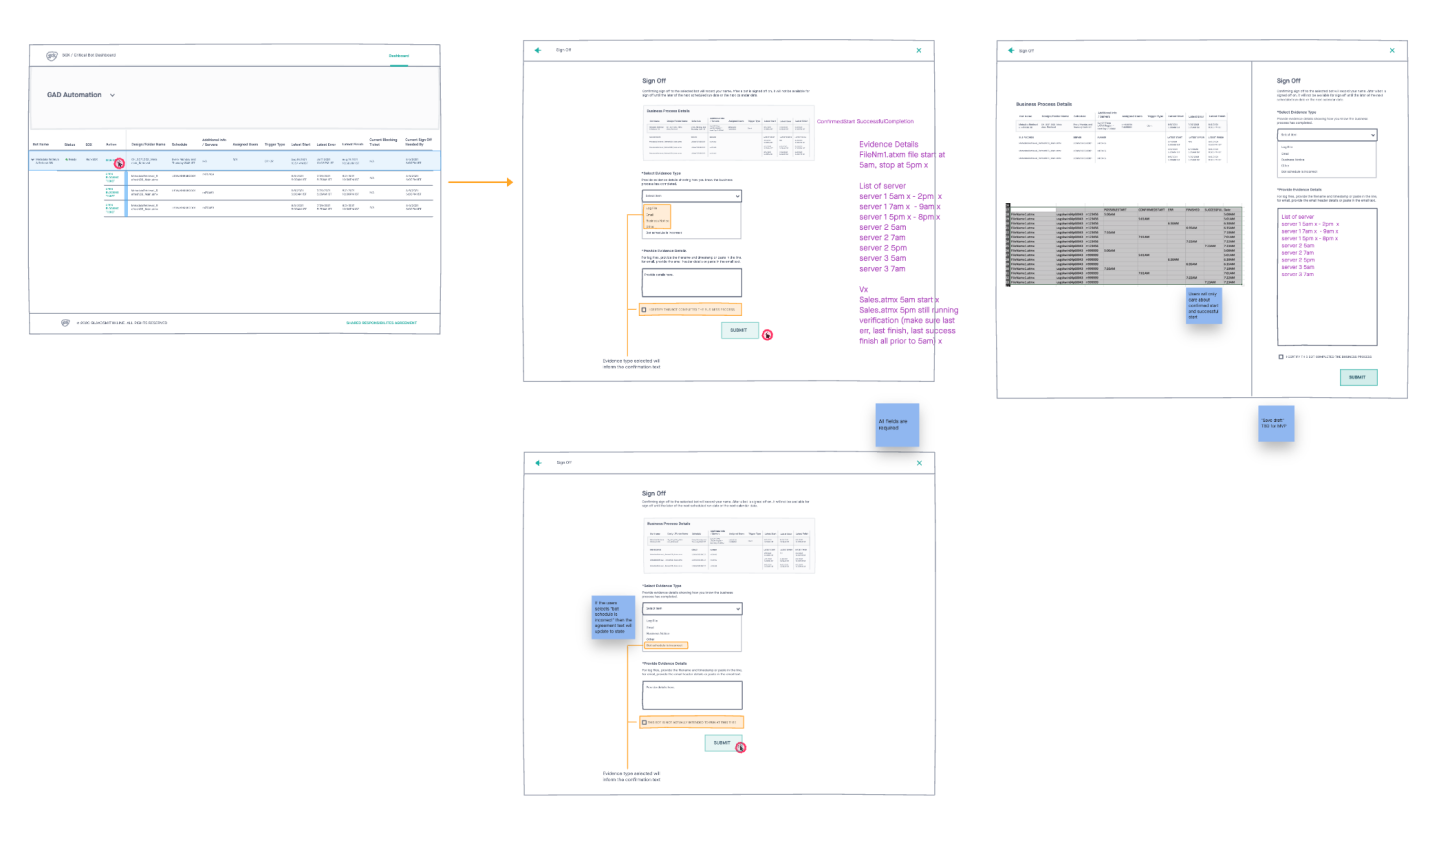
I worked with the lead engineer to determine functionality, consistent nomenclature, and key user tasks and flows. Workshops were conducted remotely using Invision Freehand as a digital white boarding tool.

Design execution
I co-created wireframes with the lead engineer to understand technical details that had to be in the dashboard. I then translated these wireframes into high fidelity screens for development handoff.

Dev Collaboration
After MVP launch, I continued to work closely with engineering to improve key flows, provide visual QA, and oversee the development of the dashboard. All collaboration occurred remotely.
Helping bot support teams close critical bot issues
This urgent design request came as the platforms group was to be audited by Deloitte to make sure our bots were functioning correctly. The design team was challenged to create a web-based system that allowed Bot Support Teams to quickly sift through bot data to be presented as evidence to auditors.
In the Global Products and Technology space at GSK, bots are engineered to automate repetitive tasks. These bots often interact with other systems and software (such as SAP) that hold sensitive information and require specific levels of security. Bot environments are often audited by third parties to make sure they comply with SOX and GxP laws. Any faults in the system are recorded as Observation Memos, and need to be resolved in order for these compliance laws to be met.
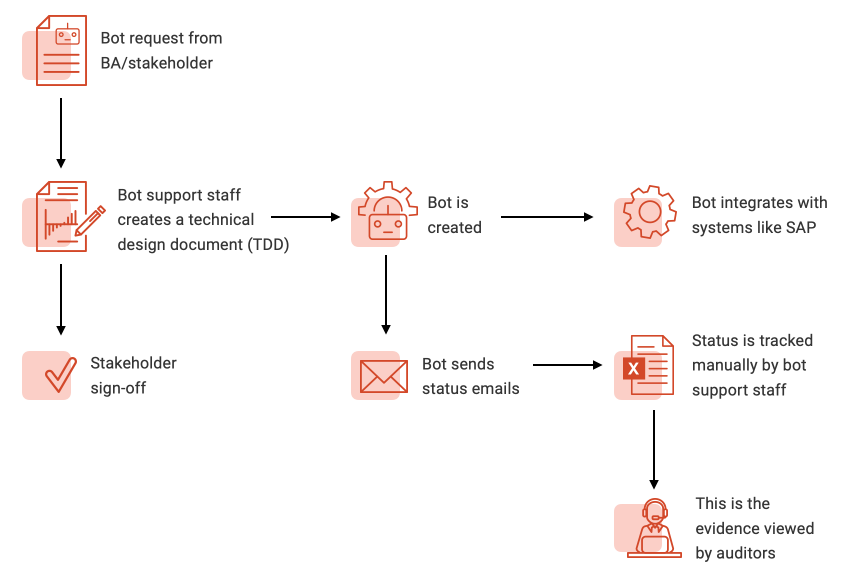
Once a bot is created, the Bot Support Team has to make sure bots are running correctly. The Bot Support Team often receives hundreds of emails from the bot per day. This is often done manually in Excel files. Data becomes difficult to sift through.

Interpreting hazy feature requirements

Allow bot support team members to sign-off on bots that were functioning correctly.

Allow bot support team members to open blocking tickets for bot owners to remediate.
SACRIFICING PROCESS FOR SPEED
Due of the urgent nature of this request, myself and one other designer had to approach this need in a very lean way. We knew this was something we had to ship quickly without understanding the full landscape of the problem.
It was especially difficult because we lacked product owners in this space. We were given less-than-ideal product requirements (pictured below) and asked to interpret them.
In order to understand these requirements, we had to remotely workshop with the lead engineer to and identify key user tasks. Initially, we had discussed 11 users tasks including the main dashboard few, but we narrowed scope to 2 tasks, which was more feasible in the time we had.

An actual screenshot of what I was given to work from.
Co-creating wireframes
Again, the subject matter was in a highly technical space that we weren’t subject matter experts. At this time, our team was working from home and spread around the country. We were able to collaborate remotely with digital white-boarding tools like Freehand in order to create wireframes together.
I had gone through several rounds of wireframes in order to properly organize the massive amounts of data required to complete the focused tasks. For me, this was an exercise in a data-heavy interface. We had to prioritize the most important pieces of information for users to see first.

The RPA Ops Dashboard
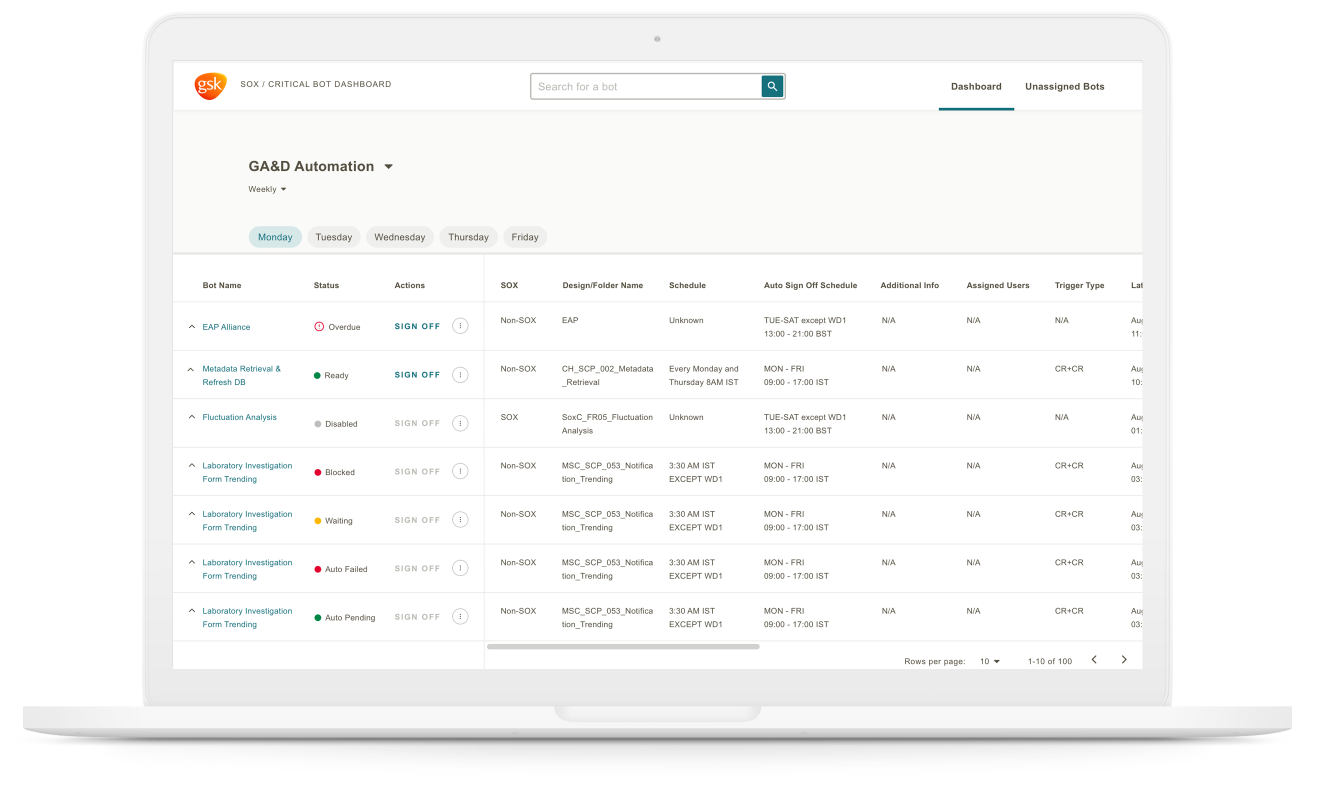
The dashboard had to accommodate a massive amount of data, per bot, that was all required information in order for the bot support staff to make informed decisions on how to proceed. Because of this, I had to use real data in the mockups that I wireframed and high-fi design mocks that I delivered to our lead engineer.
We knew that the bot support staff kept track of their data in Excel files, so we mimicked a spreadsheet format for MVP so that users would have a tool that felt familiar to them.
The challenge was prioritizing the columns of information in a logical order so that users could search and find relevant data quickly.


Accounting for information density
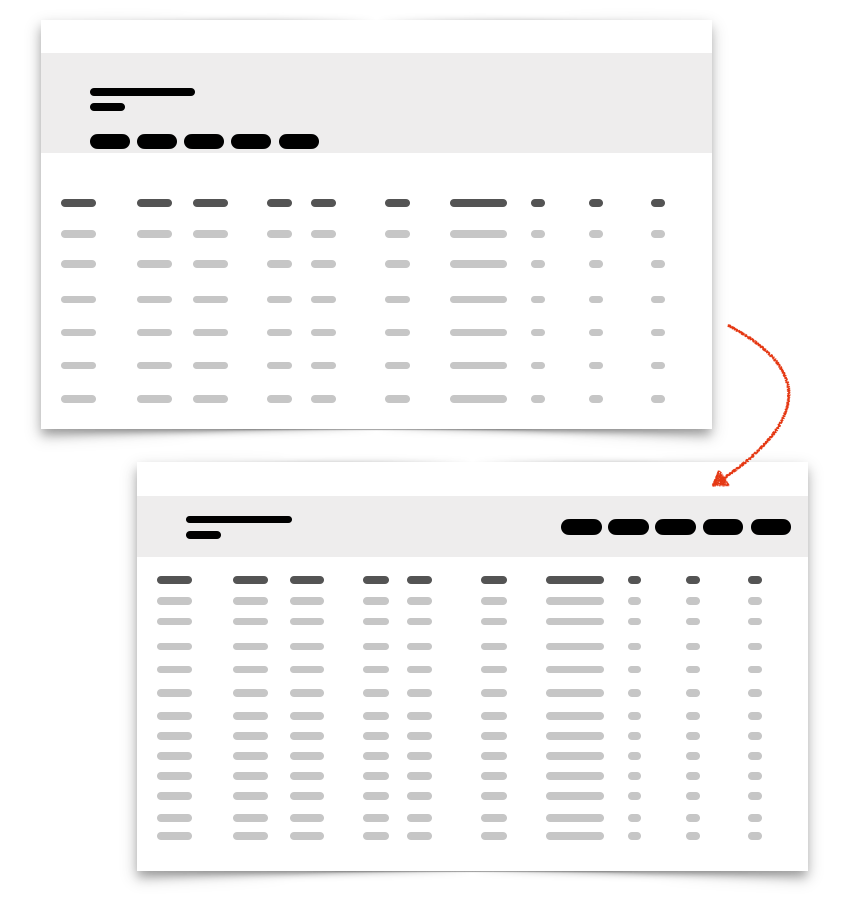
Soon after launching the MVP Dashboard, we quickly realized that bot support team members needed more information displayed on the screen, requiring a denser layout.
Traditionally, digital product design embraces simplistic flows, minimalism, and a lot of white space to allow for users to focus effectively on one task at a time. But our users needed needed to see different kinds of data at once to make decisions quickly as they were reviewing hundreds of bots per day. To add to this use case, we learned that bot support team members were often viewing data tables on PCs with less screen density.
This insight also helped to inform density guidance and principles within the Design System 2.0.

Working backwards to understand the other key players
Processes are not always linear, and this project is an example of that. We won’t always have time to do user research in the beginning, but we do have to push for research at some phase of the project. It’s necessary.
I believe it’s important to be flexible and adaptable to the circumstances of a problem. Research will always point you to the next step.
Identifying personas
After we had deployed a functioning MVP of the RPA Ops Dashboard, it was time to work backwards to understand all the users who would be interacting with the dashboard. Working with our lead engineer, we outlined his understanding of the life-cycle of a bot from awareness, creation, and maintenance.
Personas and personas journeys helped him to understand the gaps in his knowledge. These opportunities would help improve function and create a roadmap improvements and features for the dashboard.

Support staff member

Business Bot owner

Support Team Lead

RPA Platform Validator

LT Manager/Metrics Viewer
Final thoughts and learnings
My final involvement
Shortly after conducting light user research and identifying gaps in the user journey, the design team was moved out of the Enterprise Platforms org and placed horizontally across tech. With this move, I became disconnected from the product, though I tried to support it as much as I could by conducting visual QA and consulting with developers as they built out more areas of the experience.
It doesn’t have to be pretty
Sometimes the most effective interface is not always the prettiest one. Users needed to analyze a lot of data quickly, so we needed to create a custom type scale and additional functions in order to display as much information as possible, while prioritizing the most important information first. This is when knowledge of design layout and principles can really shine. You need to understand it in order to break it.
Think about scale early on
When designing for utility/administrative products that will eventually have multiple key users viewing or interacting with the tool, it’s important to think about how it will scale early on.
We had identified around 11 user tasks in the beginning and launched with only 2. This allowed me to think ahead and lay out the MVP flows in a way that would eventually accommodate more information.
Design is discovery, not creation
For organizations to have a mature product and design practice, I believe the advocates need to come from the top down.
I think this is an example of leadership saying, “build a thing!” without properly investigating what we’re actually building and why. We could have provided more value to the project if we had spent much more time in the discovery phase than the creation phase.
Questions?
Send me an email. I’d love to hear from you.
